
Chapter 2: Identifying the Value Stream
- Rod Morgan, Head of Faculty, RPM-Academy
- Oct 18, 2018
- 4 min read
Updated: Jul 5, 2022

Defining Value was the first chapter in this series of Lean Blogs. With a clear sense of what value is from the perspective of the customer, organizations can evaluate every aspect of how they facilitate the delivery of products and services to their customers.
Value stream is a term Lean practitioners use to describe the transformation of customer demand to the fulfillment of that demand… a closed loop. The tool used to capture that transformation, no surprise, is called a “value stream map”, and there are two versions to consider.
Current State Value Stream Map: a visual tool that shows all the actions (value added and non-value added) currently required to bring a product through the process of delivering it to a customer.
Future State Value Stream Map: the ultimate state where the individual processes are linked to their customers either by continuous flow or pull, and each process gets as close as possible to producing only what its customers need when they need it.
For this chapter, we will focus on the current state value stream… “Identifying the value stream” with a purpose of describing all of the resources, including time, that are consumed in the translation and transformation of customer demand to delivery on that demand. It is important to mention that a value stream map differs significantly from traditional process maps. It is a tool with a signature unique to Lean methods.

The preceding image is a popular and often referenced example of a traditional value stream map which can be found in “Learning to See”, the Shingo prize-winning book authored by Mike Rother and John Shook (1999).
A facilitated event, a value stream mapping workshop engages with subject matter experts, typically front-line staff who support each of the key activities in that chain of transformation. At a high level, the steps to completing a current state map include;
Identify the product/service family that will be the focus of the exercise
Map the end-to-end flow
Document and quantify, where possible, what happens at each stage of transformation
Walk the process (“Gemba”) to confirm the assumptions
Identify the interdependencies, including flow of information, suppliers, etc.
Update/validate the final current state map
Of course, there is a lot more to completing a value stream map in terms of the key elements that go into the map itself. If you are not familiar with how to value stream map, RPM-Academy Online offers a comprehensive course on the topic: “L007-Value Stream Mapping”.
Constraints to Flow
The key outcomes of the profound understanding achieved through current state value stream mapping are that of identification of the constraints or barriers to flow and the categorization of waste and non-value adding activities. When one considers flow, one must also be comfortable with the concept of “just in time” (JIT).
Jim Womack, founder and chairman of the Lean Enterprise Institute, describes JIT as follows: “It’s a simple idea first formulated by Kiichiro Toyoda at Toyota in the late 1930s. Each step in a value stream should pull precisely what it currently needs from the previous step in the value stream.” (https://www.lean.org/womack/DisplayObject.cfm?o=738).
Taken in the context of the customer, the entity that generates the “ultimate pull”, a value stream strives to deliver exactly what the customer wants and WHEN they want it. Logically, anything that gets in the way of the flow of that delivery while not adding value would be considered a constraint.
The Eight Wastes
Introduced early in the learning path to Lean, the categories of waste are a topic that one should be expected to memorize and internalize, whether senior management or front line staff. Every consumer, once familiar with these wastes, can cite examples where they, as a customer, have been impacted by them in their experience as a consumer.
Examples of the eight wastes will vary across industry, service versus manufacturing. The University of Oakland provides a great summary so rather than reinventing the wheel, (a yet to be classified form of waste or does this simply fall into one of the existing categories”… I’ll let you decide);
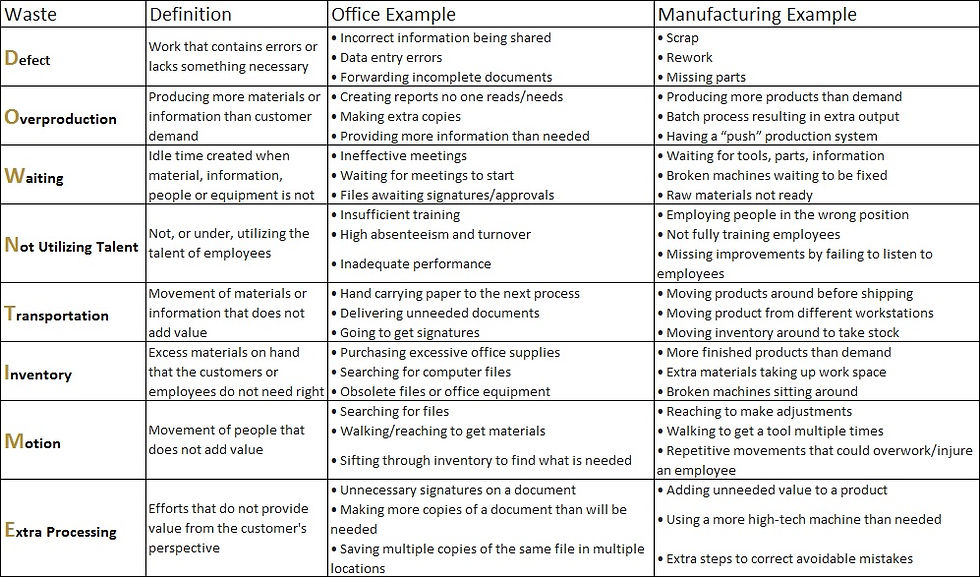
You’ll notice that the acronym “DOWNTIME” is used to help you remember each of the eight categories. Another popular acronym is “TIMWOODS” (Transportation, Inventory, Motion, Waiting, Over-processing, Overproducing, Defects, Skills underutilized).
A successful value stream mapping event is best described as an “eye-opener” for those in attendance, and one of the contributors to those “ah ha!” moments will be the wisdom of “following” the order (the “thing” being transformed) rather than following the process, which is what traditional process mapping offers. A simplistic way of contrasting to methods might be to offer the following perspectives;
Process map: “What job or task do you perform at this step of the process?”
Value stream map: “What happens to the ‘order’ at this stage of the transformation?”
Now, that may still be a bit confusing, but substitute the word “order” for something more specific to a given industry or organization. In a hospital emergency department of a health clinic, order would refer to the patient. In procurement, order would refer to the purchase requisition as it is transformed into goods/services that are delivered to the customer. In a motor vehicle licensing office, the order would be the customer seeking to renew their vehicle licensing plates.
The point I am making is that value stream mapping reinforces the focus on the ultimate customer and their demand in terms of goods or services. Yes, process mapping is still a vital tool for understanding what is being done to service demand, but value stream mapping is done from the perspective of the customer, from demand to… demand fulfillment.
Other Tools for Understanding the Current State
Combining value stream mapping with other proven and effective quality tools such as process (flow) mapping, spaghetti diagrams (used to identify motion, transportation, facility and work cell layout and design), failure mode and effects analysis (I do love this tool!), the five whys, and many more, is how we achieve a thorough and complete understanding of the current state… the good, the bad, and the ugly. And, it is with this new insight that an organization can move forward to comprehensive transformation of its value streams, both improve as well as redesign, ultimately yielding an improved customer experience, and greater efficiency and effectiveness.
How the future state is achieved, once constraints, waste, and non-value adding resource consumption has been identified, will be discussed in future chapters of this blog. Until then,
Be well. Be safe. And keep adding value!


Comments